
Market Divergence: Understanding its Implications
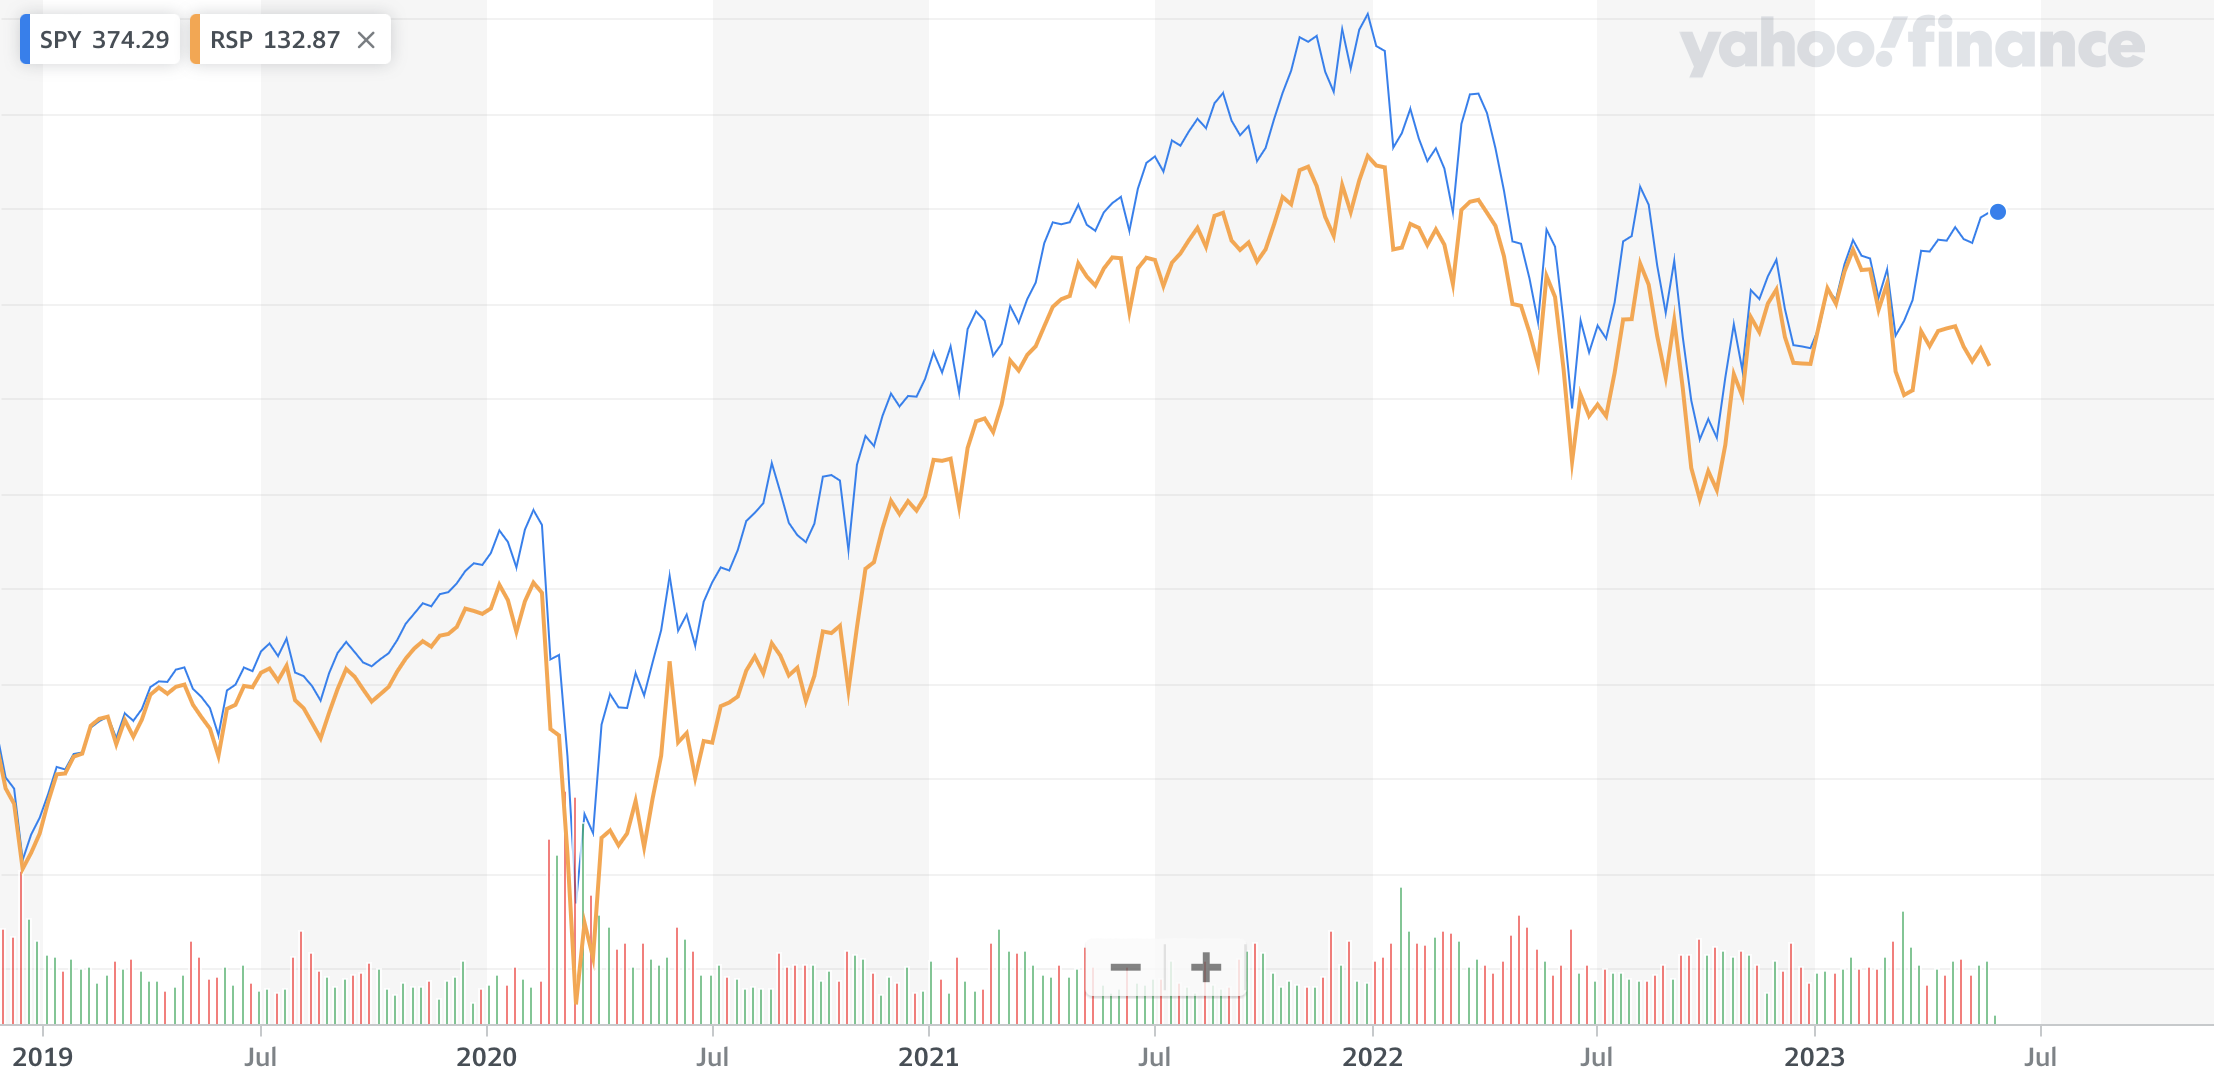
- There is a noticeable divergence occurring between a select few of the largest S&P 500 companies and the remaining companies that make up the index.
- This divergence is reflected in the performance of the SPY (+9.9% YTD), a market cap-weighted ETF that tracts the performance of the S&P 500, and the RSP(-0.1% YTD), an equal-weighted S&P 500 ETF which, assigns an equal percentage regardless of market capitalization to every company in the S&P 500.
- Several factors have attributed to the performance disparity of these two ETFs. Including oversold conditions in the tech sector at the end of 2022, a negative shift in market sentiment, and performance chasing, have played a role in the reallocation of capital from the broader market into companies with more predictable cash flow and healthy balance sheets.
2023 YTD S&P 500 Heat Map
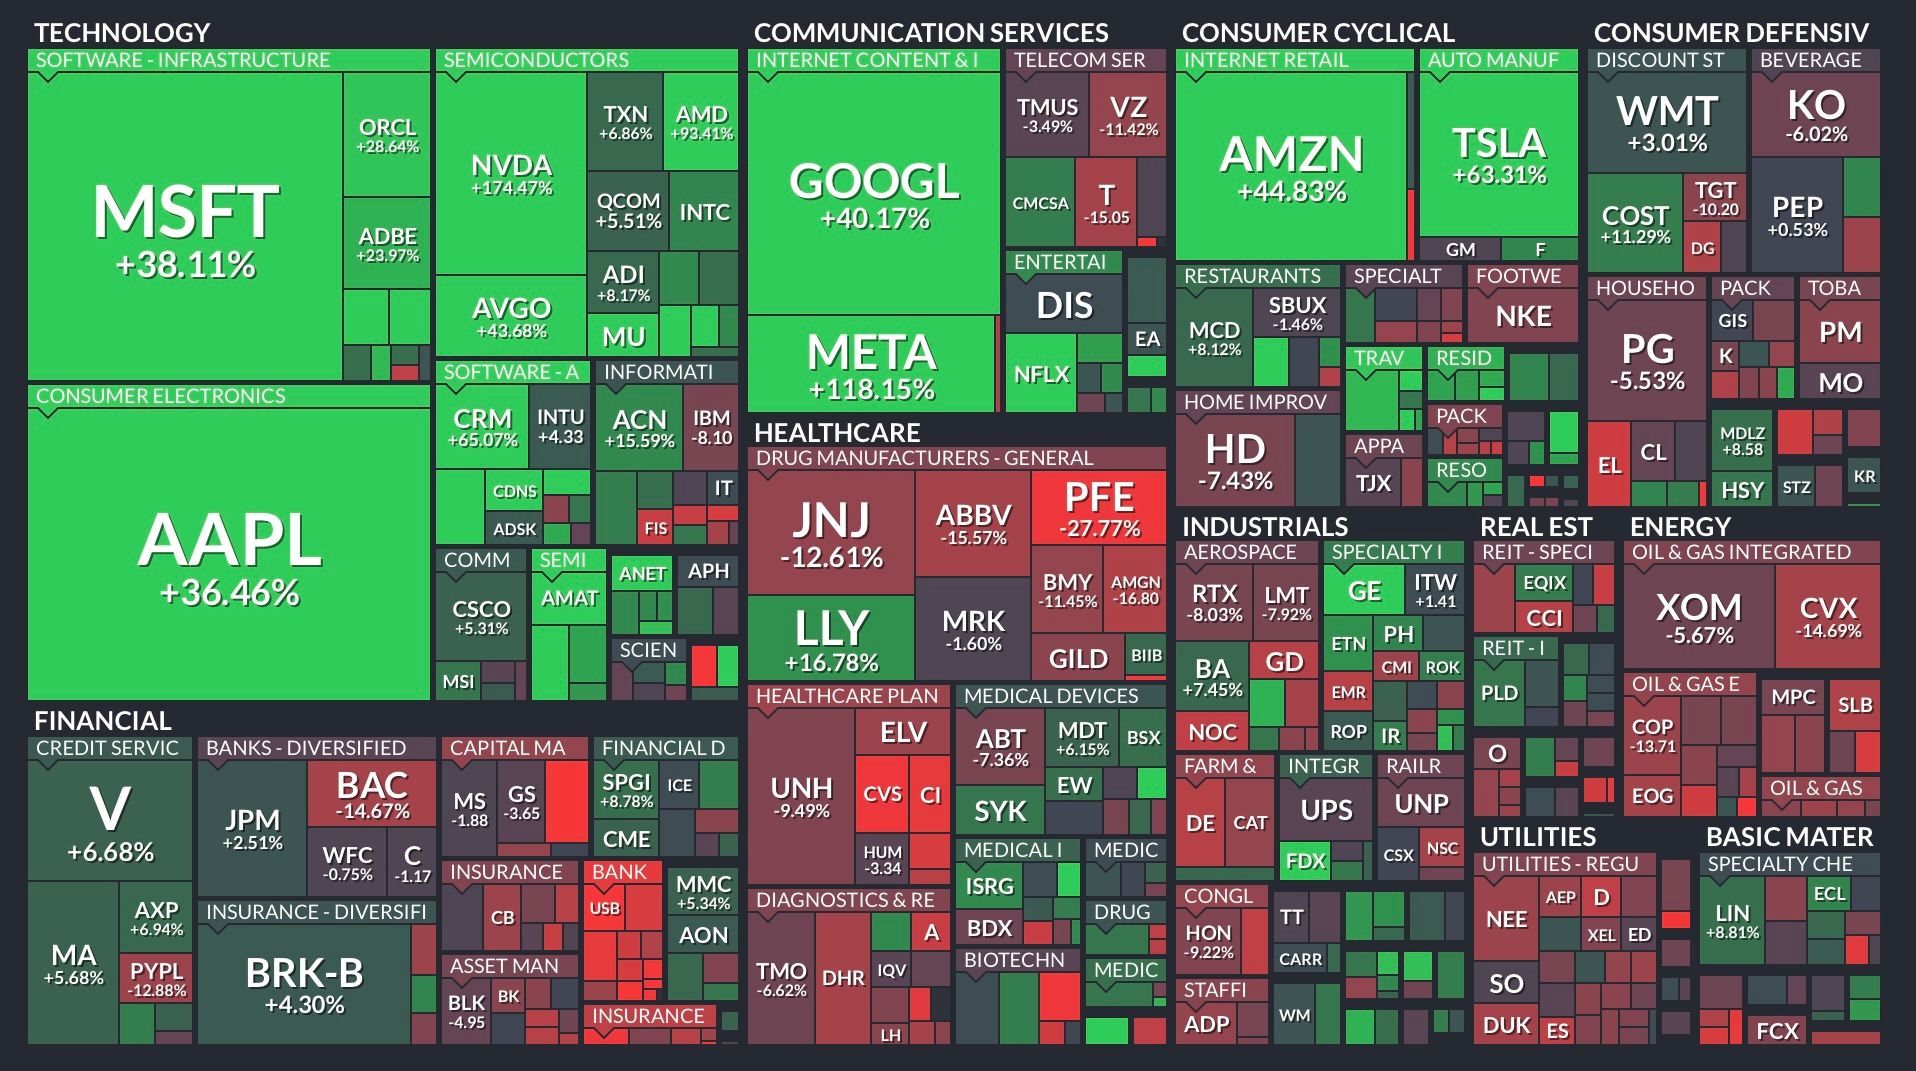
- The heat map clearly shows the divergence in the market this year.
- The area occupied in the graphic correlates directly to the companies weighting in the S&P 500.
- If mega-cap names continue to attract capital inflow, the S&P 500 is more likely to remain resilient. However, to sustain a more lasting rally in equities in the coming months broader market participation will be necessary in my opinion.
As the S&P 500 continues to test the 4,200 level with weak market breadth, I plan to maintain my cautious outlook on equities.
FINVIZ.com - Stock Screener
Stock screener for investors and traders, financial visualizations.


The opinions expressed are for informational purposes only and should not be considered advice; individual circumstances may vary, seek professional guidance before making any financial decisions.